Debugger
Pause a rule mid-run, inspect every variable including live Inventor objects, step line by line, and watch expressions as they change.
The debugger lets you stop a rule while it is running, look at what every variable holds at that exact moment, and then continue line by line. It works with plain values (numbers, strings, booleans), with .NET collections, and with real Inventor objects like a PartDocument or a Parameters collection.
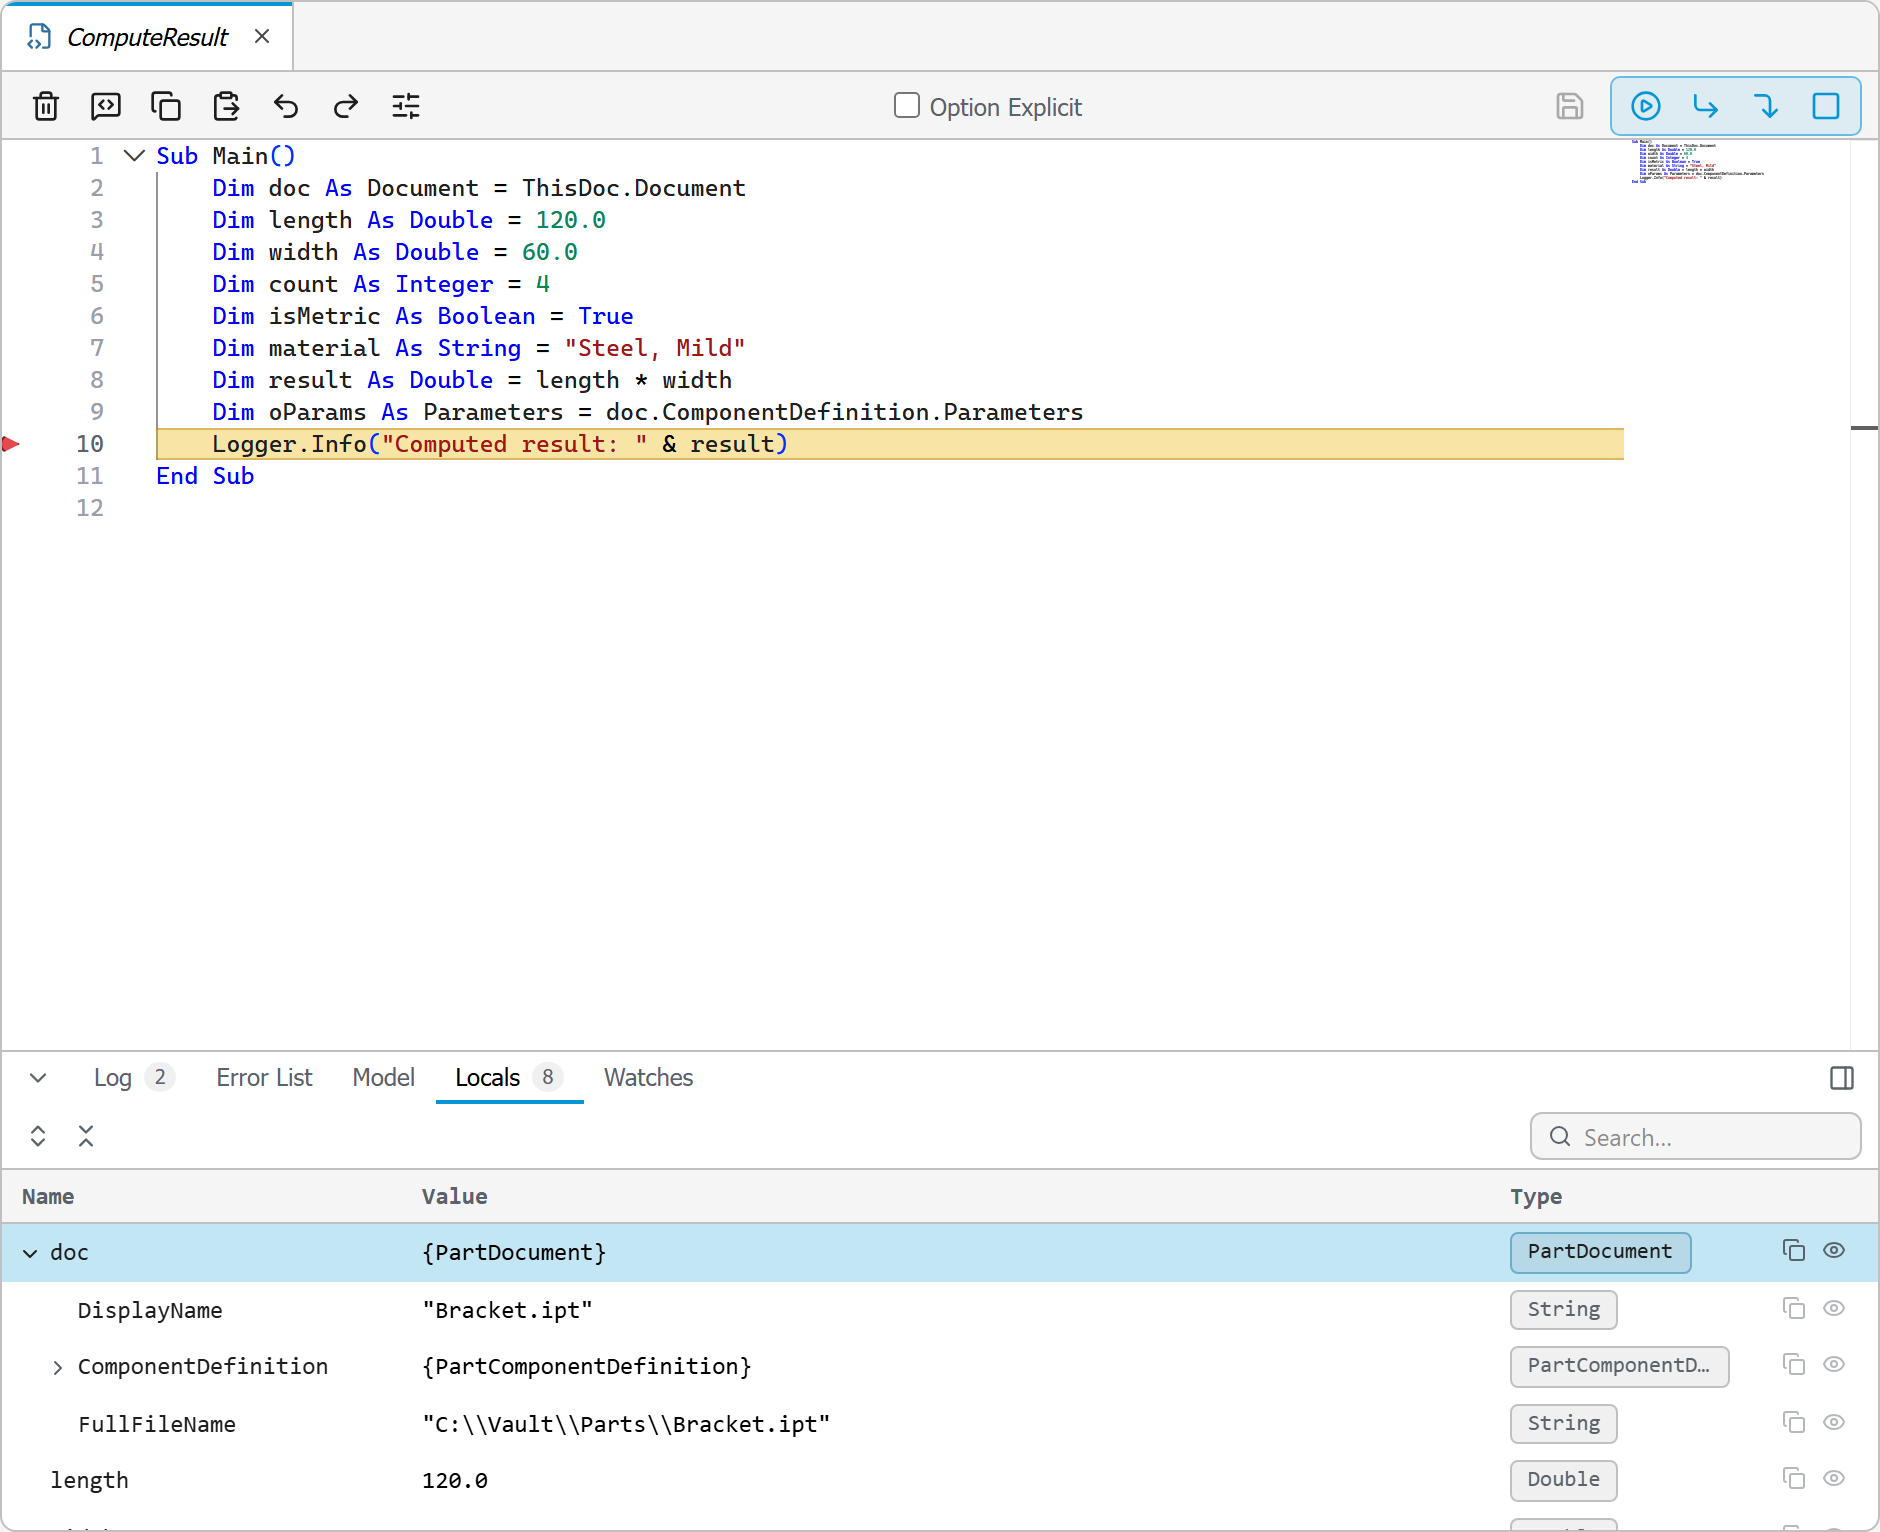
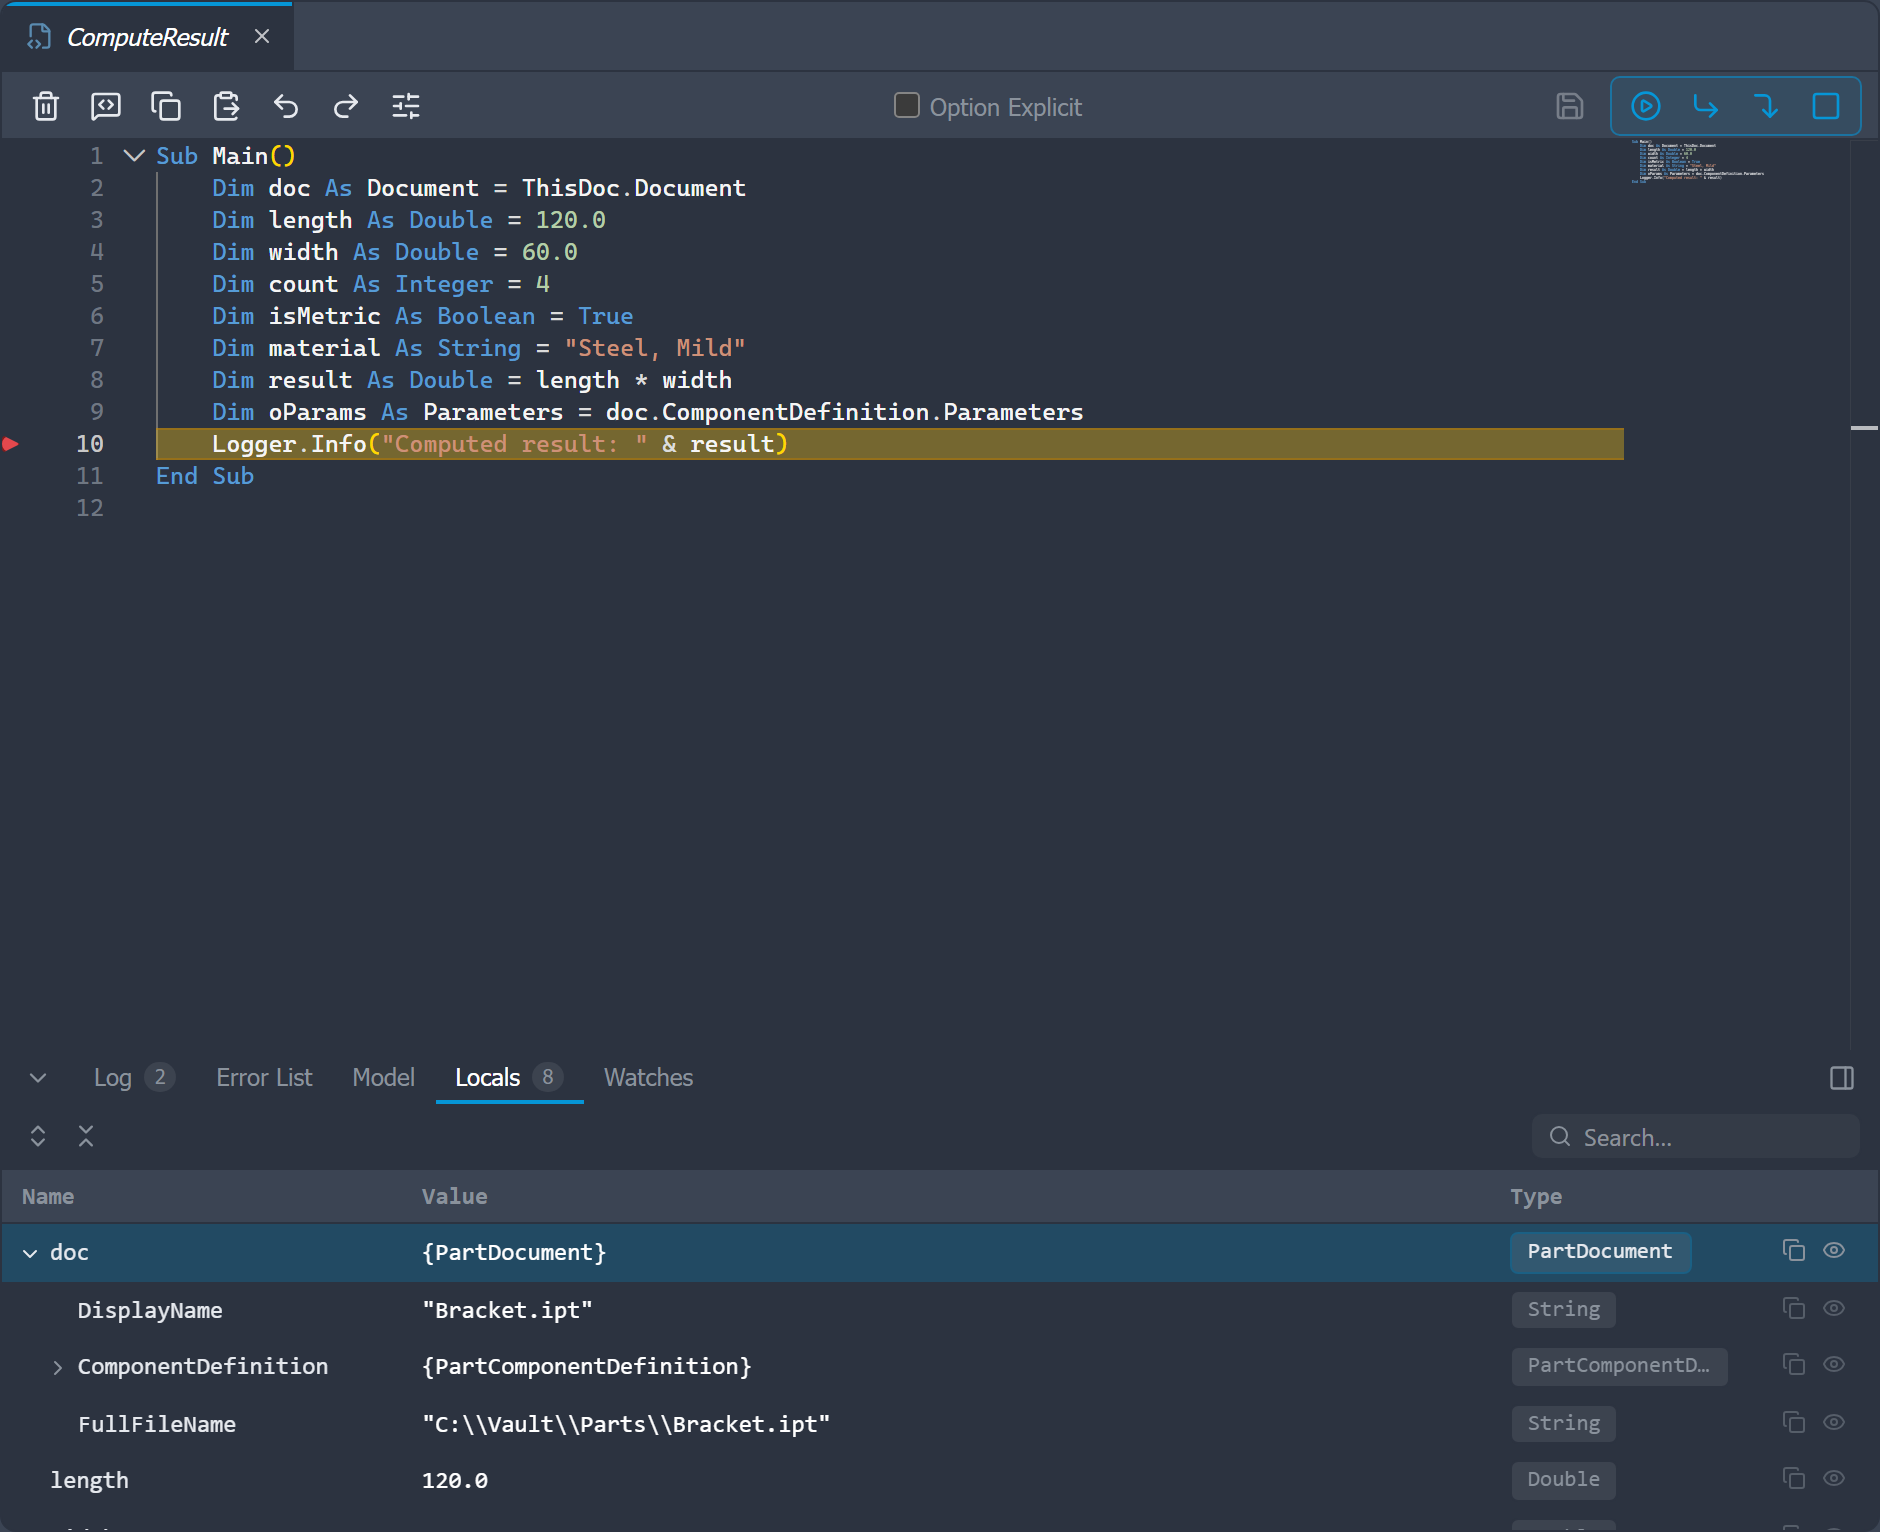
Starting a debug session
- Open a rule (document or external) and switch the run button from Save & Run to Debug. Click the small arrow next to the green run button and pick Debug; the button then shows the bug icon and
F5(or the run button itself) launches a debug run instead of a normal one. - Optionally set breakpoints: right-click a line and choose Toggle breakpoint, or click in the gutter next to the line number.
- Press the run button (or
F5).
With breakpoints, the rule runs at full speed and pauses at the first breakpoint it reaches. Without any breakpoints, it pauses on the very first line so you can single-step from the top.
External rules debug the same way as document rules — the instrumented copy runs against the
active document, exactly as the external rule itself would. One caveat: an external rule that
pulls in files by a relative path (for example AddVbFile "helpers.vb") resolves those
against a temporary location during a debug run, so use absolute paths if a rule depends on
them.
While paused, the current line is highlighted and the toolbar shows the debug controls: Continue (run to the next breakpoint or to the end), Step over (F10, run this line and pause on the next one), Step into (F11, follow the call into your own Sub or Function), and Stop (abandon the session: the rule unwinds at the current line instead of running to the end). Stop is also available while the rule is running between checkpoints; it takes effect at the next line the rule reaches.
Locals
The Locals tab in the bottom pane lists every variable in scope at the paused line: name, current value, and type. It fills in automatically at each pause.
- Objects and collections have an expander arrow. Expanding a
PartDocumentshows its real properties, read live from Inventor at that moment; expanding a list shows its items. - The search box filters the tree by name, value, or type.
- Every row has a copy button for its value and an eye button that promotes it to a watch, and the toolbar can expand or collapse everything at once.
- Columns are resizable, and the whole Locals/Watches pair can be moved into a panel beside the editor with the panel button in the tab header.
Watches
The Watches tab next to Locals evaluates expressions you choose, at every pause. Type an expression and press Enter to add it; it re-evaluates each time the rule pauses or you step, so you can watch a value change line by line. You can also add a watch from the editor's right-click menu (Add to Watch on the identifier under the cursor) or from the eye button on any Locals row.
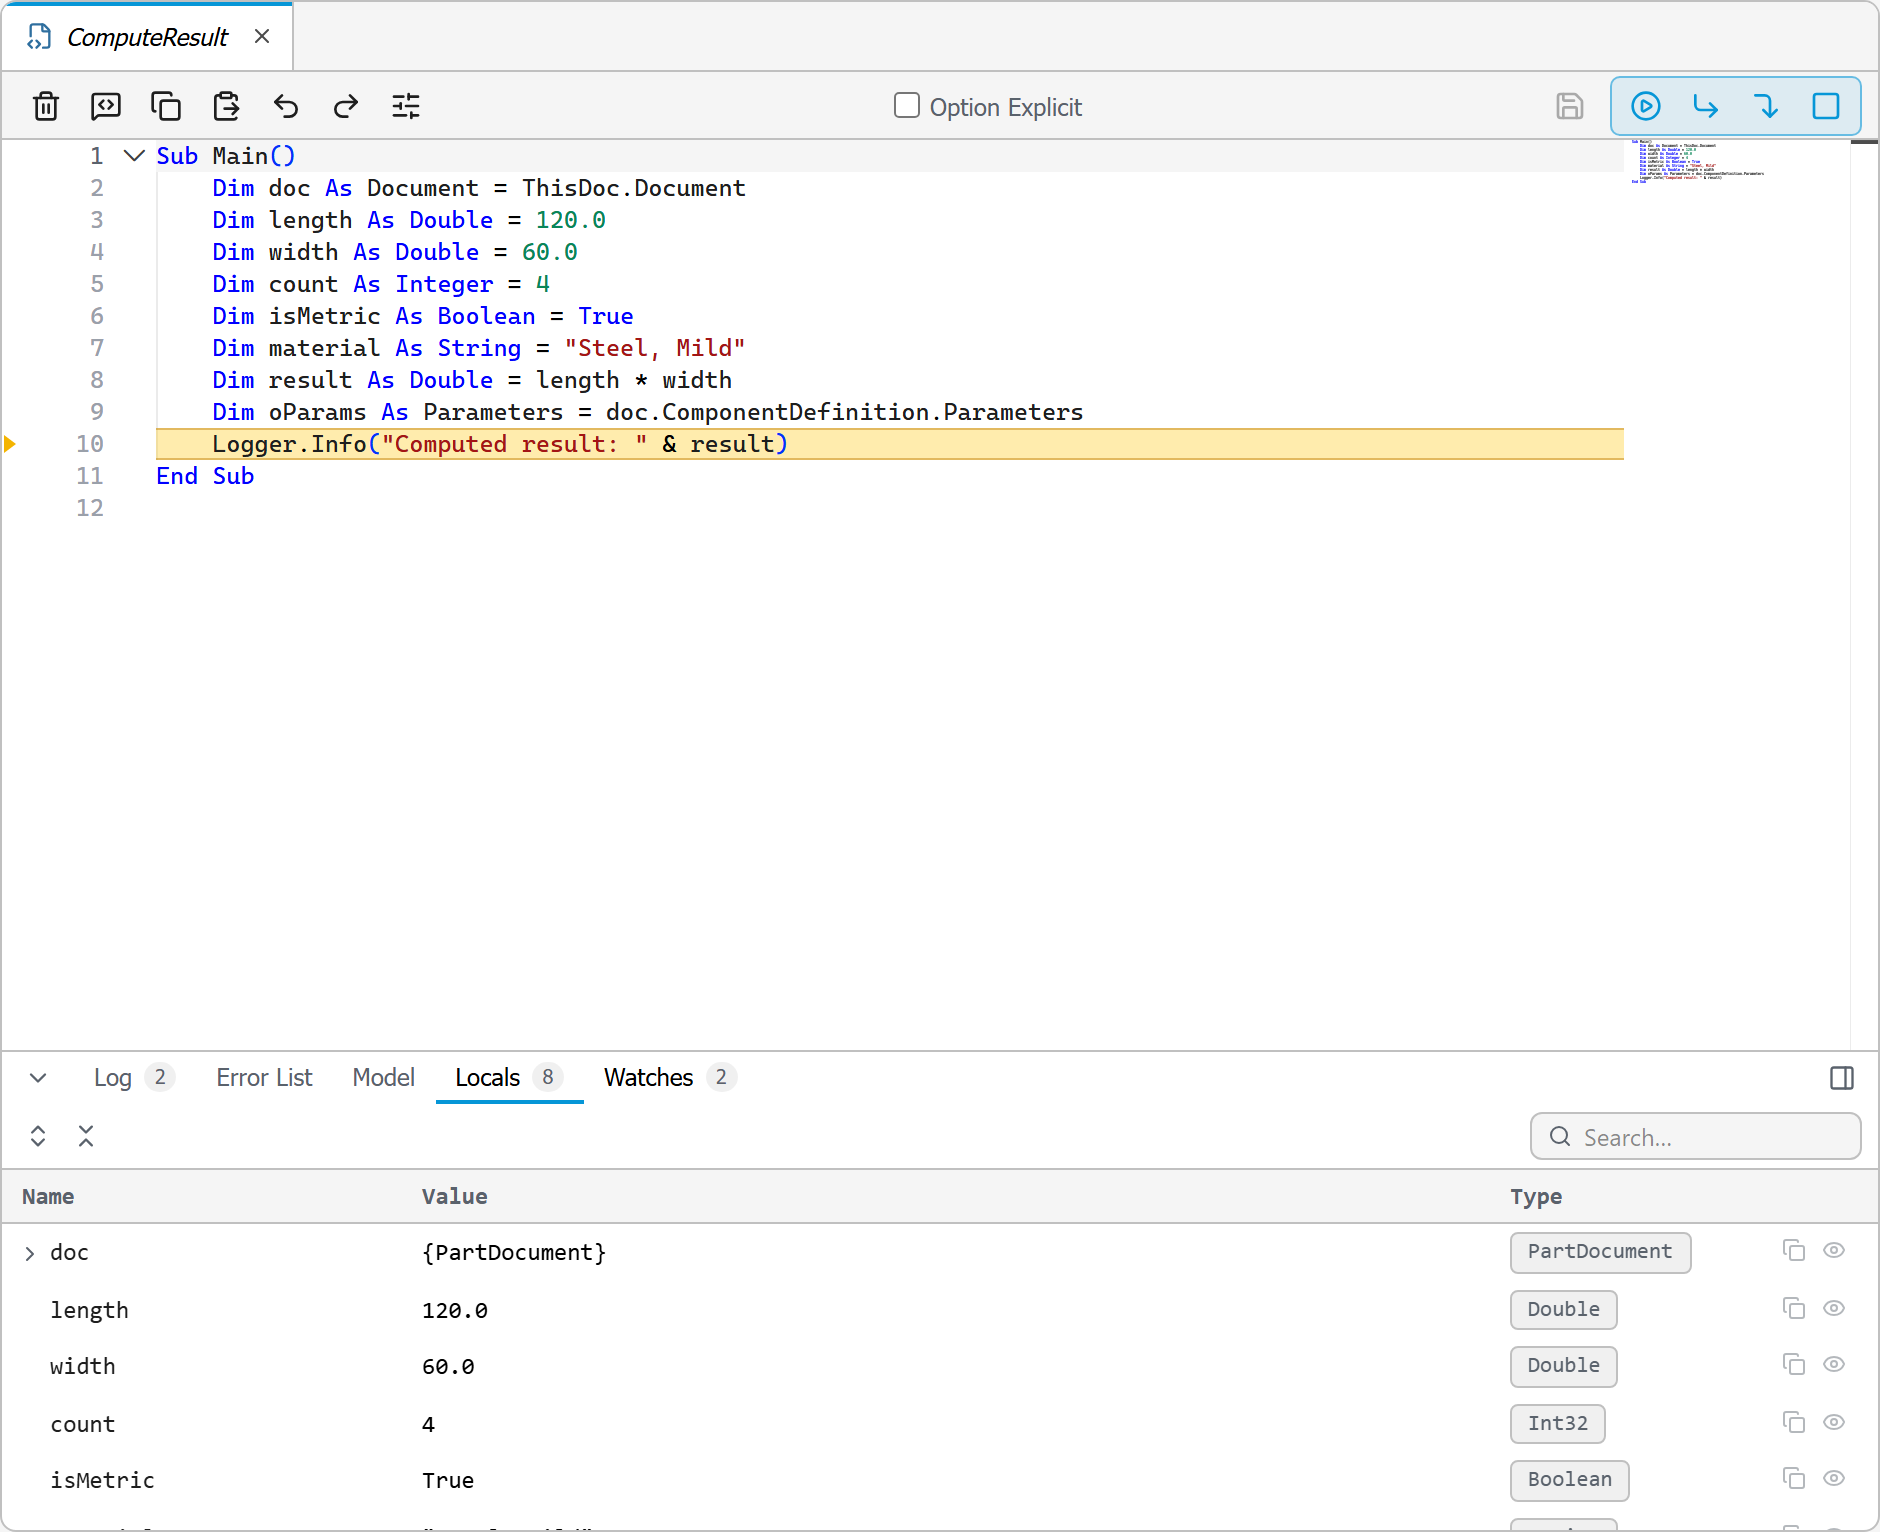
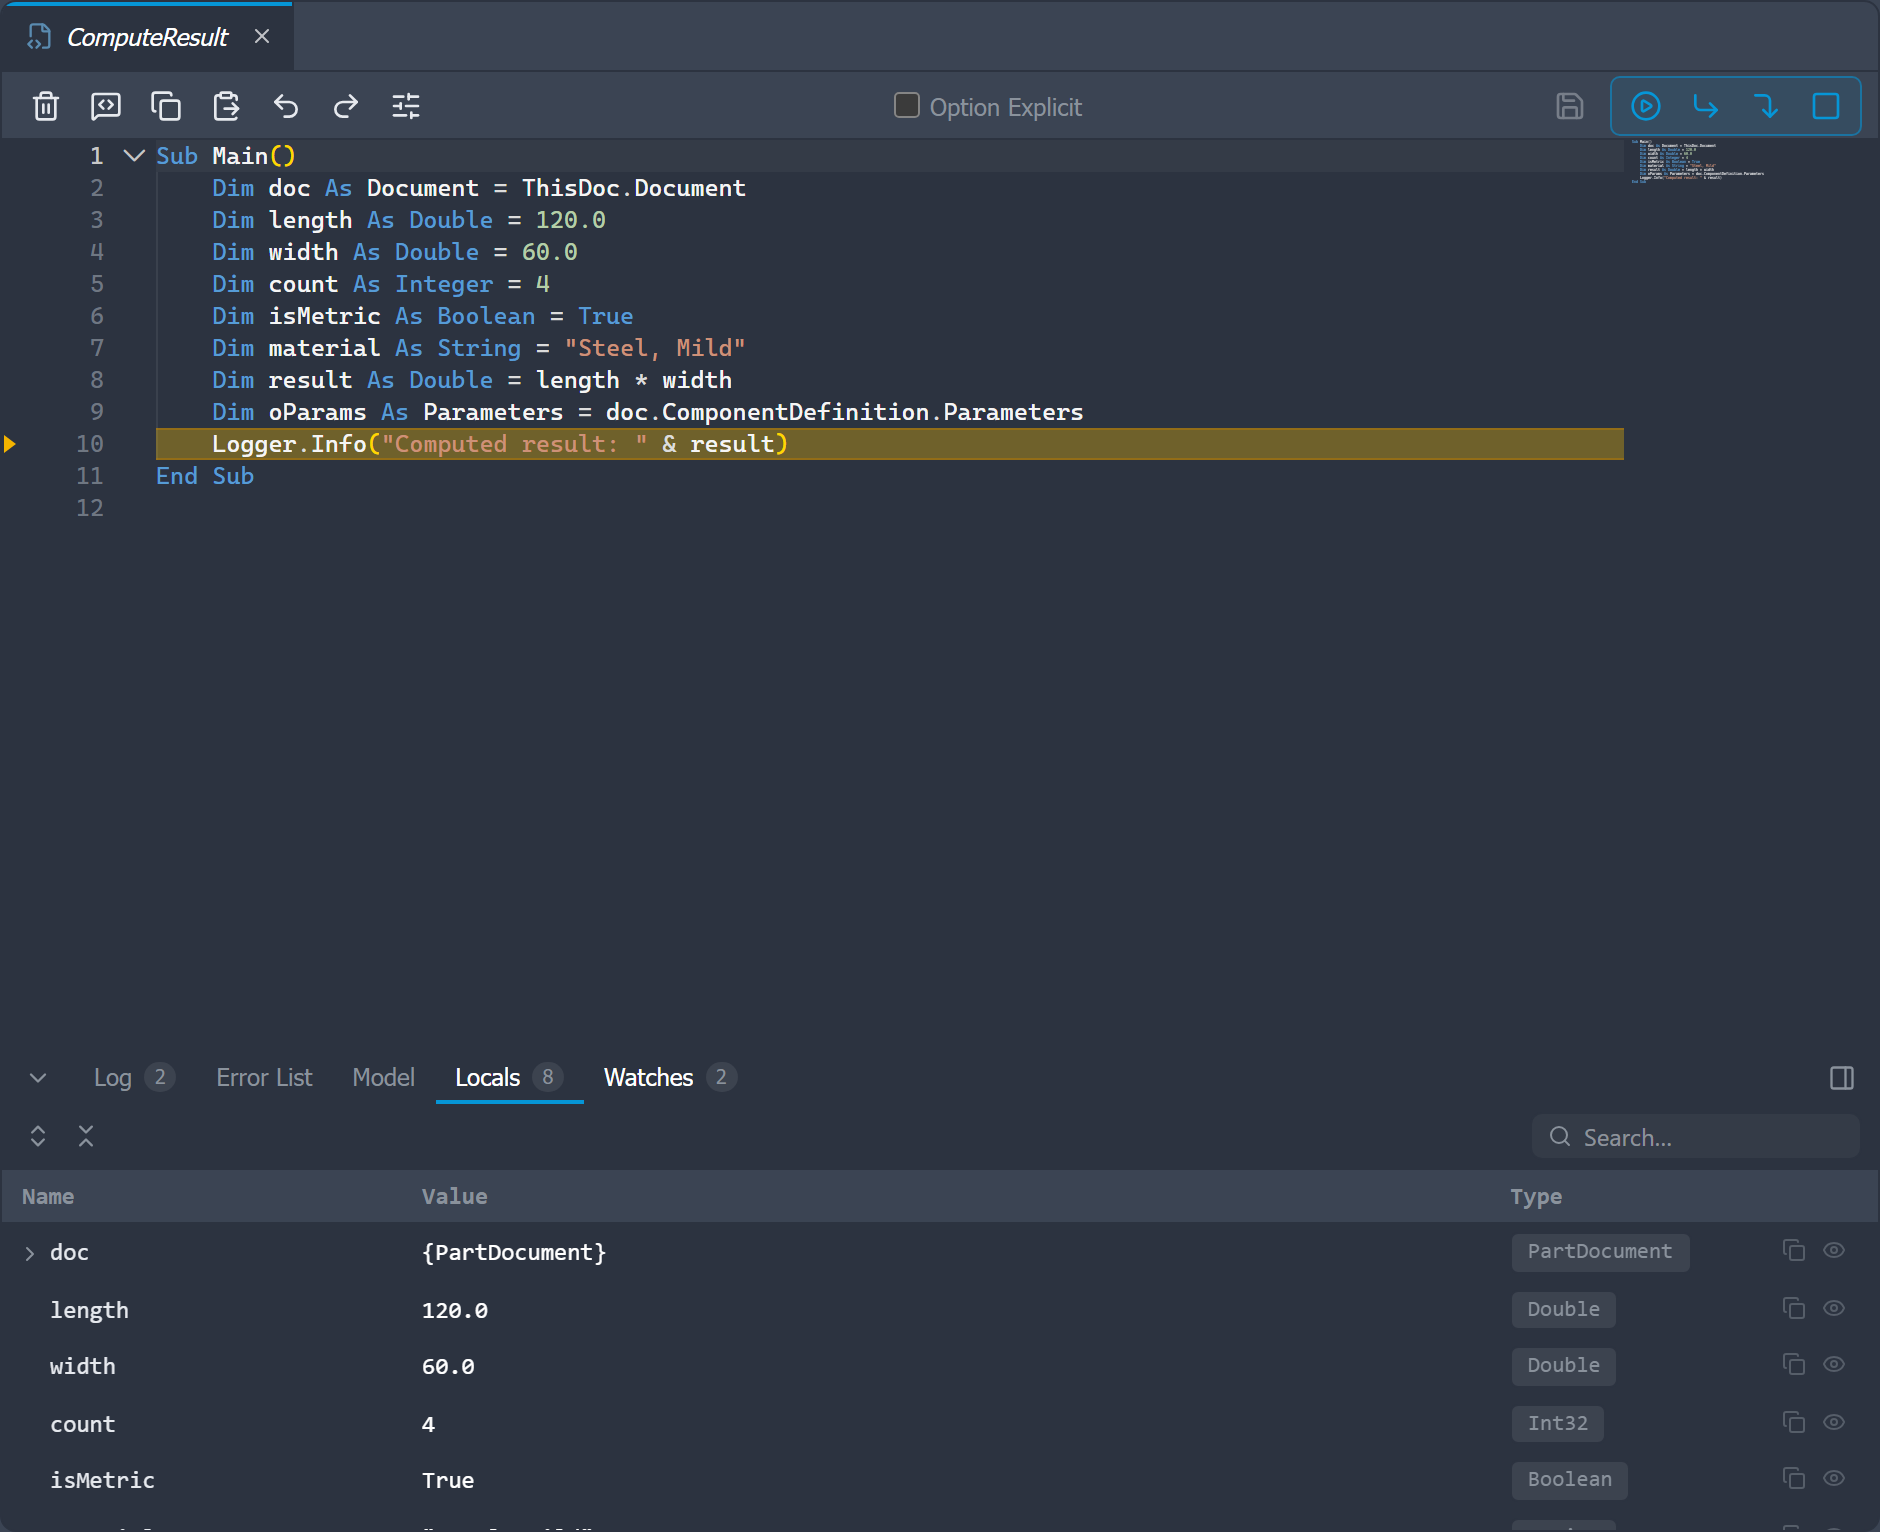
A watch expression is a variable name followed by properties and numeric indexes, for example:
doc.DisplayNamepartDef.Parameters.Countsizes(0)ornames[2]
Method calls, arithmetic, and string indexes (like oParams("Length")) are not supported; use the expandable tree instead. Watches are saved with your editor settings, so you can set them up once and reuse them in later sessions.
Both tabs can be moved together into a panel beside the editor (the panel icon in the tab header), which is handy when the locals list is long. The panel appears whenever a debug session runs and remembers its width.
What actually happens when you debug
It helps to know what the debugger does, because it is different from what a "classic" debugger (like Visual Studio) does:
- Your rule really runs. The editor makes a temporary copy of your rule with an invisible checkpoint after every line and runs that copy through the normal iLogic engine. The copy is named
__ExtrabbitDebug_…(you will see it in the run log) and is removed automatically. Your actual rule is not modified. - A pause is a real wait, not a freeze. At a checkpoint the rule simply waits inside Inventor until you continue. Inventor itself stays alive the whole time, which is exactly why the debugger can do something Visual Studio cannot: read live Inventor objects while paused. A classic debugger freezes all of Inventor, and then nobody is left to answer questions like "what is this document's name?".
- Everything up to the pause has really happened. If your rule set a parameter or created a feature before the breakpoint, the model has genuinely changed. Pausing does not undo or suspend those changes, and Stop does not roll them back: it only prevents the lines after the current one from running.
- Inspecting values reads them for real. Expanding an Inventor object in Locals or evaluating a watch calls the object's actual properties at that moment. For normal properties that is a harmless read, but it is a live call into Inventor, not a snapshot.
While a rule is paused it is still occupying Inventor: finish the session with Continue or Stop rather than leaving it paused and working in the model. The editor stays fully usable during the pause; Inventor commands should wait until the rule has completed.
The debugger pauses only on the lines of your rule. Calls into the Inventor API or iLogic functions run through in one step; Step into follows only your own Subs and Functions.